Background: Although hemoglobin S (HbS) trait has historically been considered a relatively benign condition, emerging data support it is a risk factor for several clinical manifestations such as thrombosis, exertional-related complications, renal medullary cell carcinoma, chronic kidney disease, and osteonecrosis. Data also support HbS trait mice have an intermediary behavioral pain phenotype between control and sickle cell disease (SCD) mice. Despite these emerging data regarding the clinical phenotype associated with HbS trait, little is known about the biology of this condition. To investigate the biology of HbS trait, we analyzed gene expression profiles in healthy individuals with HbS trait and compared these to individuals without HbS trait and individuals with SCD. We hypothesized that those with HbS trait will have gene expression patterns that are different than individuals without HbS trait and those with SCD.
Methods: Plasma samples were obtained from individuals with SCD and healthy Black individuals during baseline health. Systematic HbS trait testing was completed for all healthy controls. Plasma-based transcription analyses were conducted. Briefly, gene transcription was assessed in healthy blood donor peripheral blood mononuclear cells (PMBCs) after being co-cultured with participant plasma. PMBCs served as sensors to plasma born factors that induced gene transcription which was then measured with an Affymetrix array. Gene transcription profiles were analyzed to identify differentially expressed transcripts between individuals with SCD at baseline health and healthy controls with and without HbS trait that exhibited a fold change of |Log2R|>0.263, ANOVA p<0.05. Further, differentially expressed transcripts were also assessed between those with and without HbS trait using the same fold change cutoff. Mean gene expression heat maps of these differentially expressed transcripts were created using Genesis for three groups: individuals with SCD, individuals with HbS trait, and individuals without HbS trait. An annotated heat map of differentially expressed genes between those with and without HbS trait was also created.
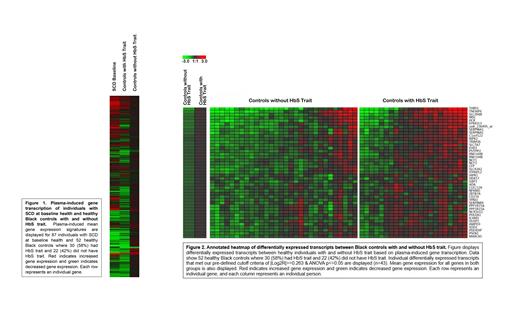
Results: Plasma-induced mean gene expression signatures were obtained from 87 individuals with SCD at baseline health and 52 healthy Black controls; 30 (58%) had documented HbS trait and 22 (42%) did not. Mean age of SCD patients during baseline health was 14.5 (SD 14.2) years, 51.7% were female, and 70.1% had HbSS/HbSβ 0thal. Mean age of Black controls with HbS trait was 28.4 (SD 12.8) years, and 80.6% were female and mean age of those without HbS trait was 20.5 (SD 18.2) years and 70.8% were female. Figure 1 shows the mean plasma-induced gene expression profiles for individuals with SCD at baseline health and healthy Black controls with and without HbS trait. Data show controls with HbS trait have intermediary gene expression patterns between those without HbS trait and those with SCD. We found 43 transcripts were significantly differentially expressed between those with and without HbS trait. Figure 2 displays the annotated heat map of these 43 differentially expressed transcripts.
Conclusions: Healthy individuals with HbS trait have transcriptional signatures that are intermediary between those without HbS trait and those with SCD. Further, individuals with and without HbS trait have differentially expressed transcripts suggesting different biological processes in HbS trait may play a role in the pathophysiology of clinical complications in individuals with HbS trait. These findings also underscore the need to account for HbS trait status of healthy controls when including them as a comparison group for individuals with SCD in biological investigations. Further work is needed to understand the biological meaning behind these findings.
Disclosures
No relevant conflicts of interest to declare.


This feature is available to Subscribers Only
Sign In or Create an Account Close Modal